In Part 1 of this blog series, I just started to touch on how the Power BI Scorecard will be utilized for the EOS Traction Methodology Metrics. As a quick recap, the idea of using the Power BI Scorecards is primarily for the Data component of the EOS system. As the EOS system encourages tracking KPIs, we at Opal wanted to find an easy and methodical way of seeing our progress.
In Part 2, I would like to go more in-depth on how Opal uses the Scorecards and Metrics to support our Goals and Rocks, along with reviewing some struggles and recommendations.
Scorecards and Metrics – Preparation
To get started with the overall process of setting up the Metrics, there should be some preparation to ensure a fluid approach to the Scorecard. Looking back at our overall process, we would recommend the following steps:
- As in Part 1, develop your Traction Goals to be measurable. Without this, they aren’t true goals
- Take the Traction Goals and develop the Main Traction Metrics
- These are the high-level areas that will be the main measurables. For instance, if your goal is to increase sales, perhaps you have the main metric that is measured as increasing sales by 15%
- Develop Sub-Metrics that support the Main Traction Metrics, if necessary.
- Supporting the main metric building up to 15%, you may create a sub-metric for increasing the number of sales each month.
- Determine if the Metrics will be Rolled Up or Not Rolled Up
- Determine if the Metric will be Manually updated or Automatically updated (Connected to a Data Source)
- Determine if the Metric has a corresponding value in Power BI (for Opal, we used cards)
| Metric | Sub-Metric 1 | Sub-Metric 2 | Rolled Up? | Is Automatic |
| Revenue | No | Yes | ||
| Increase Realized Rates | No | Yes | ||
| No Agreement Realized | No | Yes | ||
| Unlimited Agreement | No | Yes | ||
| WIP (Work in Progress) | No | Yes | ||
| WIP – 12 Month Rolling AVG | No | Yes | ||
| PTO This Month (Days) | No | No | ||
| PTO Remaining This Month | No | No | ||
| Licensing/Subscriptions | Yes | Yes | ||
| Azure Subscriptions | No | Yes | ||
| Microsoft Licensing | No | Yes | ||
| New Clients | Yes | Yes | ||
| Dynamics | Yes | Yes | ||
| New Business Central | No | Yes | ||
| New Dynamics Sales | No | Yes | ||
| New Dynamics GP | No | Yes | ||
| Power Platform | Yes | Yes | ||
| ConnectWise Power BI | No | Yes | ||
| ConnectWise Power Automate | No | Yes | ||
| QBR | No | No |
As we started to build out the process of implementing the Scorecard and Metrics based on the grid above, we saw the benefits from the metrics within the first few days.
Scorecards and Metrics – Implementation
As stated in Part 1, the documentation is fairly easy to follow, but I wanted to give a quick overview of what Opal did to start. Here are the steps we took to implement one of the groupings.
1. Open Power BI and select “Metrics” from the main menu
2. Click in the upper right corner to add a new Scorecard
a. Give your Scorecard a title

3. Give your metric a name, owner, values, and dates.
a. If you haven’t set up your values yet, no problem, you can always update later

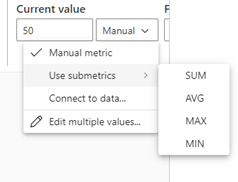
b. If you are able to link your data to a value on a Power BI report, you can select the Manual dropdown and click Connect to Data
c. To show your available Power BI reports, select a report and click Next
d. You will then see the report and select the Page and visual to Connect
-
- Note that all filters will remain with the tile
4. Now that you have created and linked your first Metric, you can create submetrics or new main metrics and repeat the steps above for each.
a. Note that for Current value and Target value, you have different options. The Aggregate of the submetrics will only aggregate the next layer down and not all children. Also note that of the 5 main metrics we have at Opal, only 2 were fully rolled up, so it would not be a requirement for all.
Pros and Cons
As we worked through the process, we came across some high-level Pros and Cons that can help:
Pros:
- Connecting to Data is easy, as long as the value is available
- Daily Updates with History
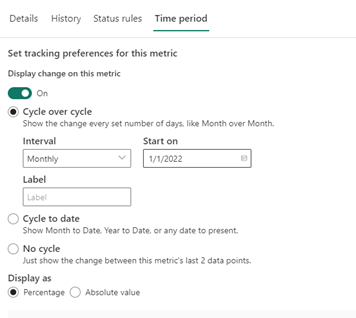
- Different Tracking Periods for the graphs
- Alerts/Notifications
- Automatic Status Updates
- Rollup vs. Not Rolled Up
- Integration with Power Automate – Will show in Part 3 of blog series (with some basic automation for Statuses in this blog)
Cons:
- History may have some odd dates in the future
- Re-ordering of the Metrics based on created once altered (once you make a certain edit, you may have to re-order the metrics)
- Alerts/Notifications – this isn’t a Con once everything is set up (when setting up, best not to assign anyone until set up as the person will receive a lot of alerts)
Let me explain each of these Pros and Cons in further detail.
Pros:
- Connecting to Data is easy, as long as the value is available
- This was explained above, otherwise, it can be updated manually
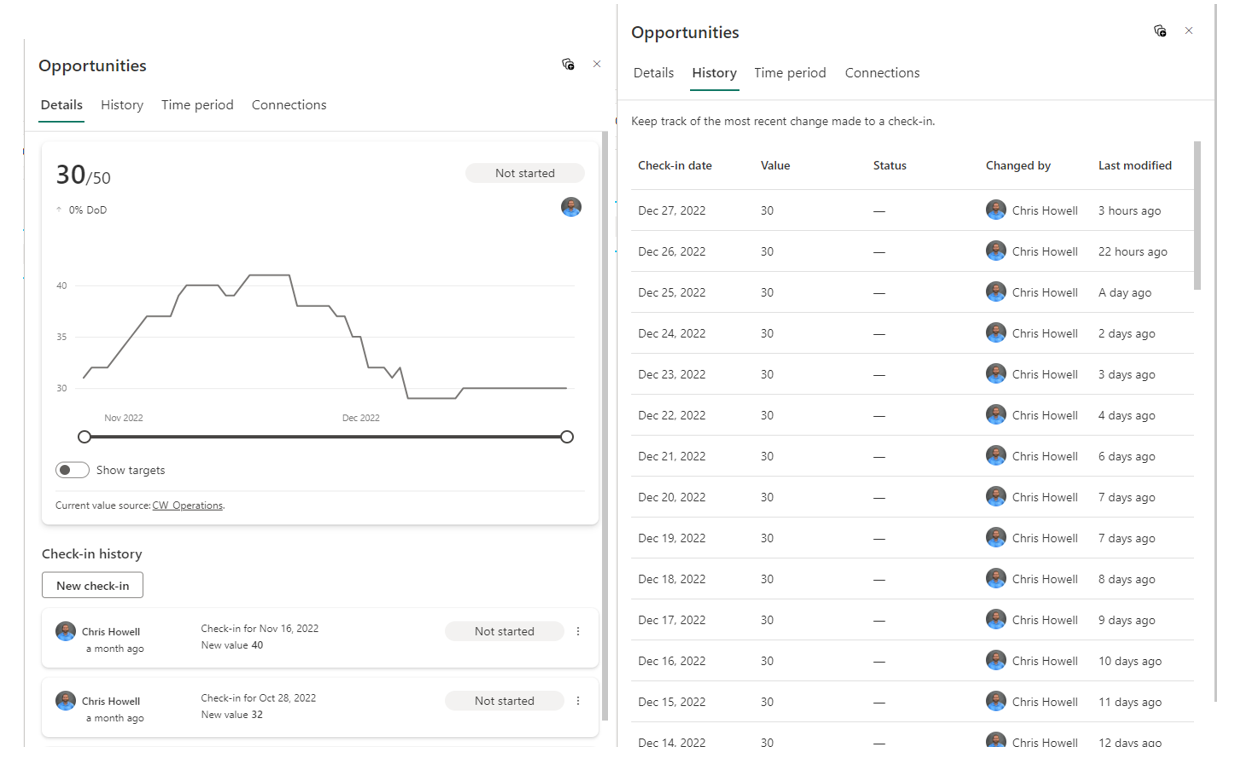
- Daily Updates with History
- By clicking on the Metric itself, it brings up a pop-up window on the right
- Different Tracking Periods for the graphs
- This has to be in Edit mode to adjust
- The options allow for the different Time Periods to be shown. It would be your own preference.
- Alerts/Notifications
- As information is updated, you can get notifications on your phone if you have the Power BI app, along with Microsoft Teams

- Automatic Status Updates
- We noticed that this is the only location that would allow for the Statuses to be automatically updated and Power Automate, which I would think would allow, does not. With this in mind, the logic can be complex, but should be simplified when possible.
- Here is a snippet of one of the Status change updates we have
- For us, Behind is worse than At Risk, otherwise, we are on track.

- Rollup vs. Not Rolled Up
- This was explained above, but to reiterate, we found that many of ours did not truly roll up in the normal sense, so we created a total card in Power BI and used that. The sub-metrics are under the overall header and support the Main metric, but just don’t roll up.
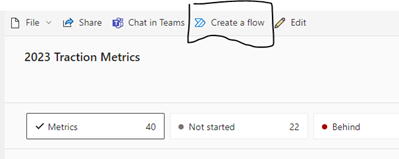
- Integration with Power Automate – Will show in Part 3 of the blog series (with some basic automation for Statuses featured in this blog)
- Here are a few steps if you are adventurous in the area of Power Automate

Cons
- History may have some odd dates in the future
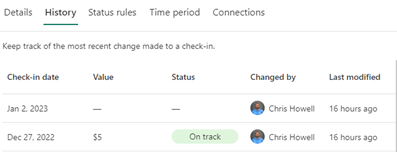
- Re-ordering of the Metrics based on created once altered
- Once you make a certain edit, you may have to re-order the metrics
- Alerts/Notifications
- This isn’t a Con once everything is set up (when setting up, best not to assign anyone until set up as the person will receive a lot of alerts)
QUESTIONS?
If you have questions about this process or the Traction series as a whole, post a comment below. We will do our best to help! Stay tuned for Part 3, where automation will be added to streamline the different processes.


