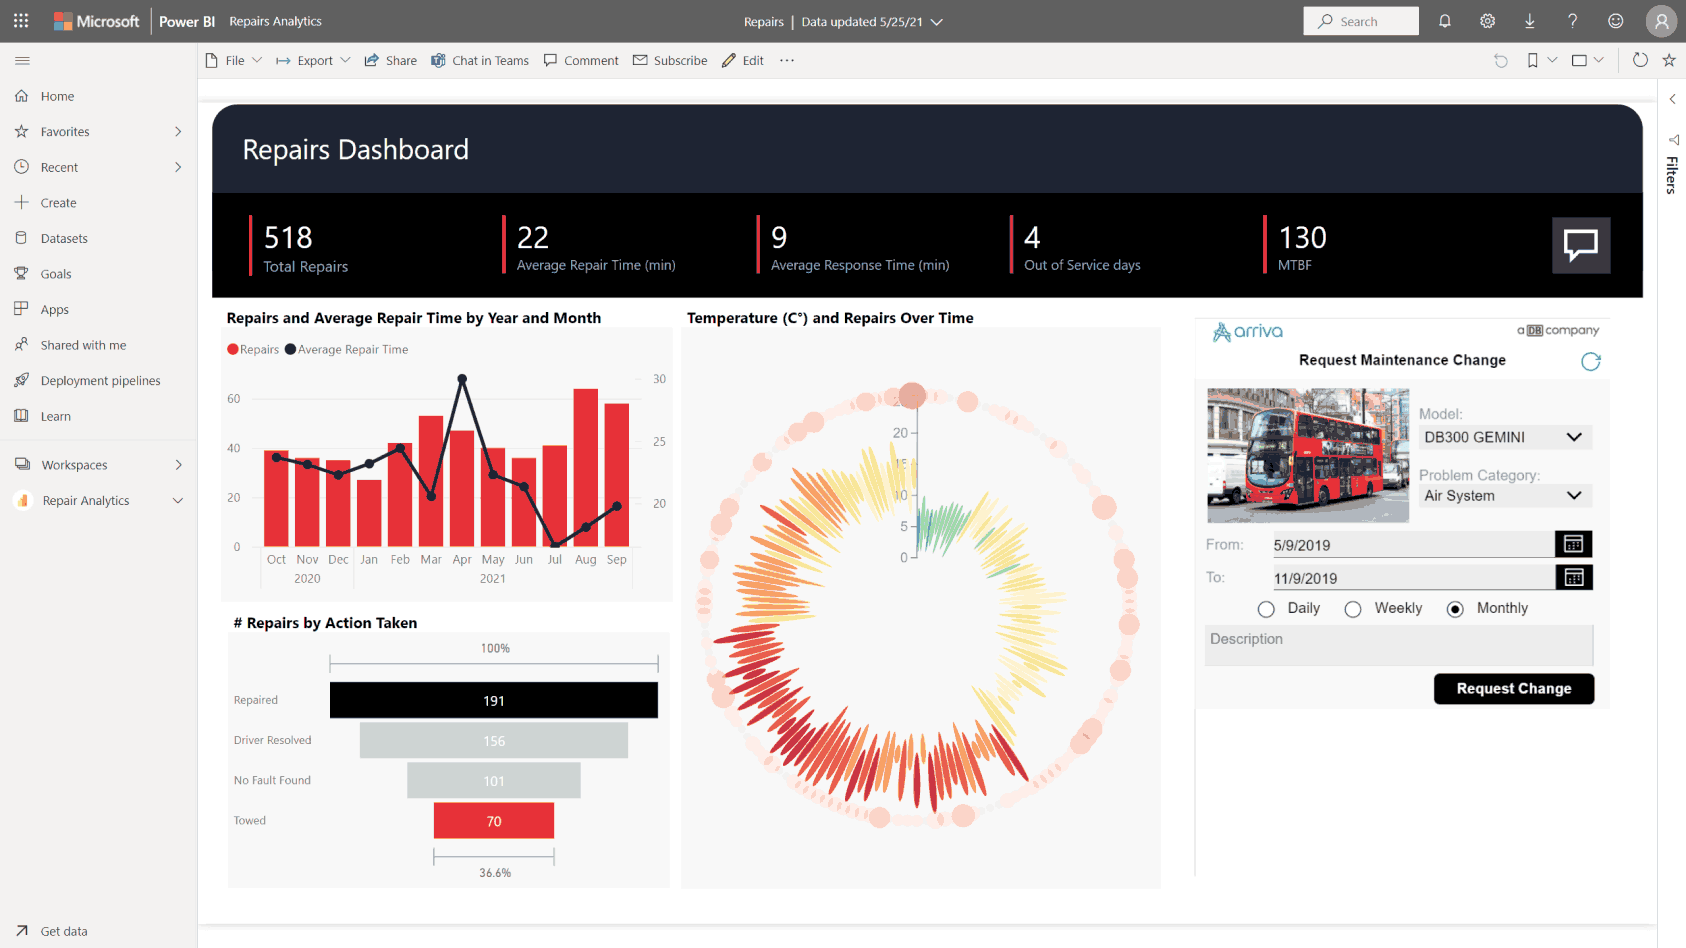
Turn Data into Insights
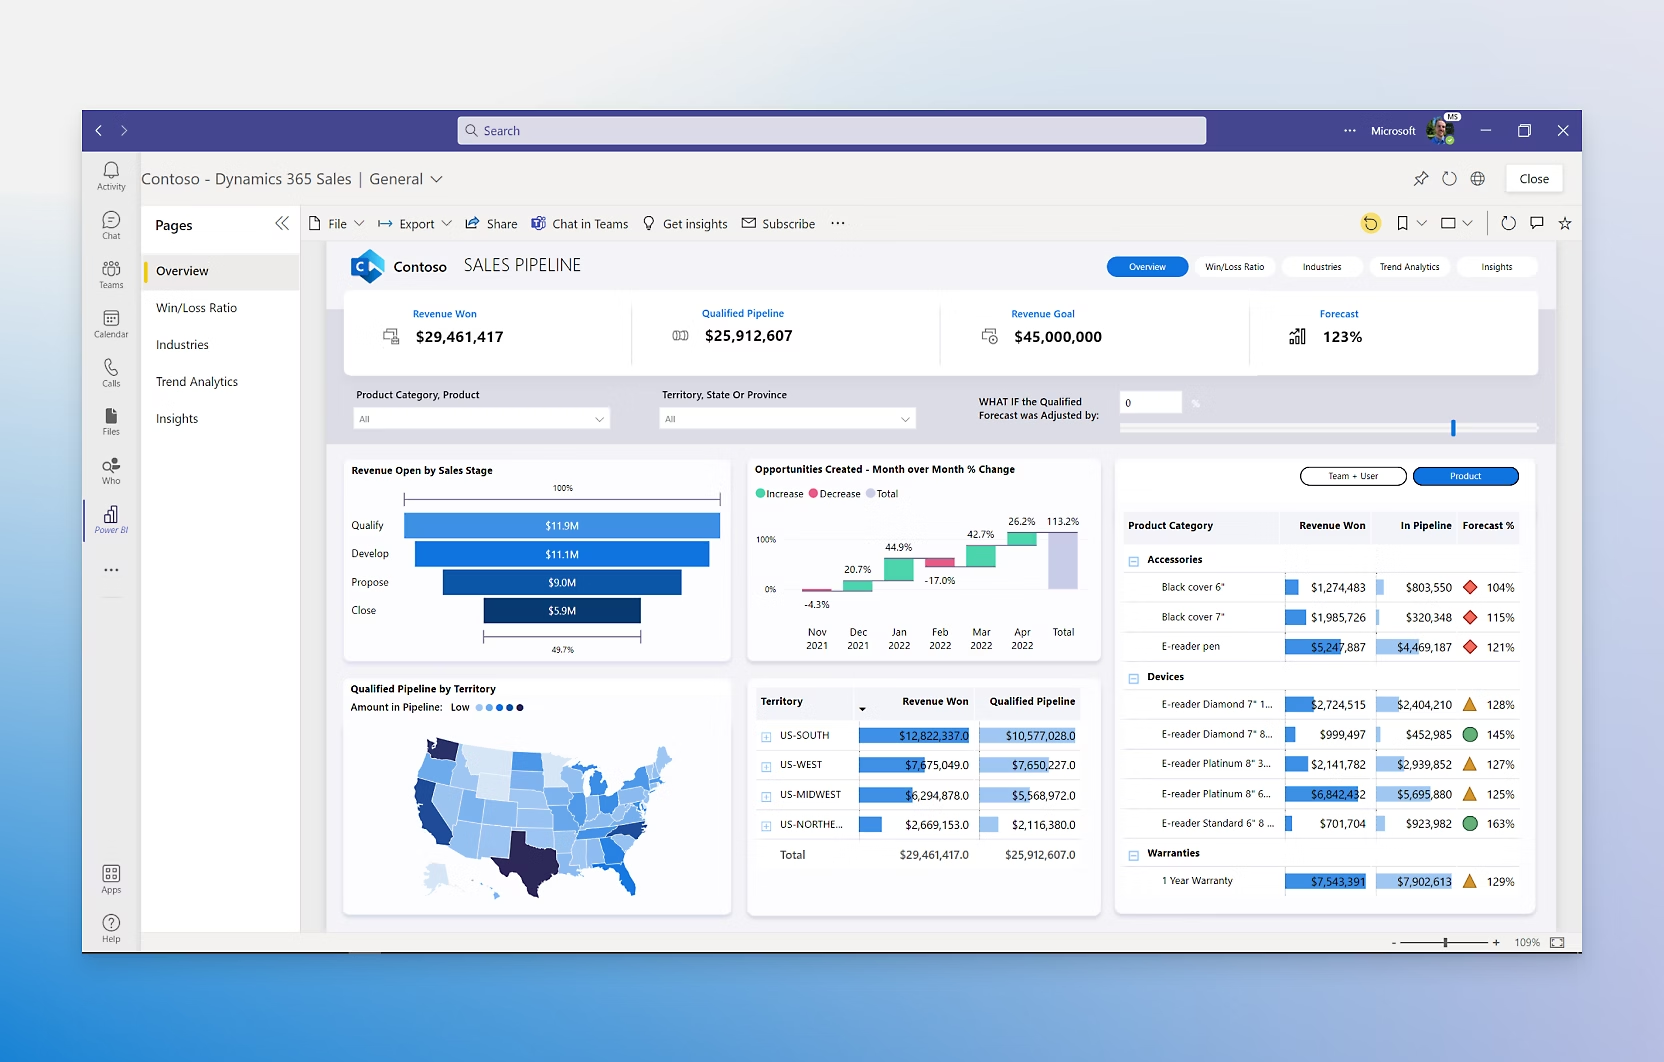
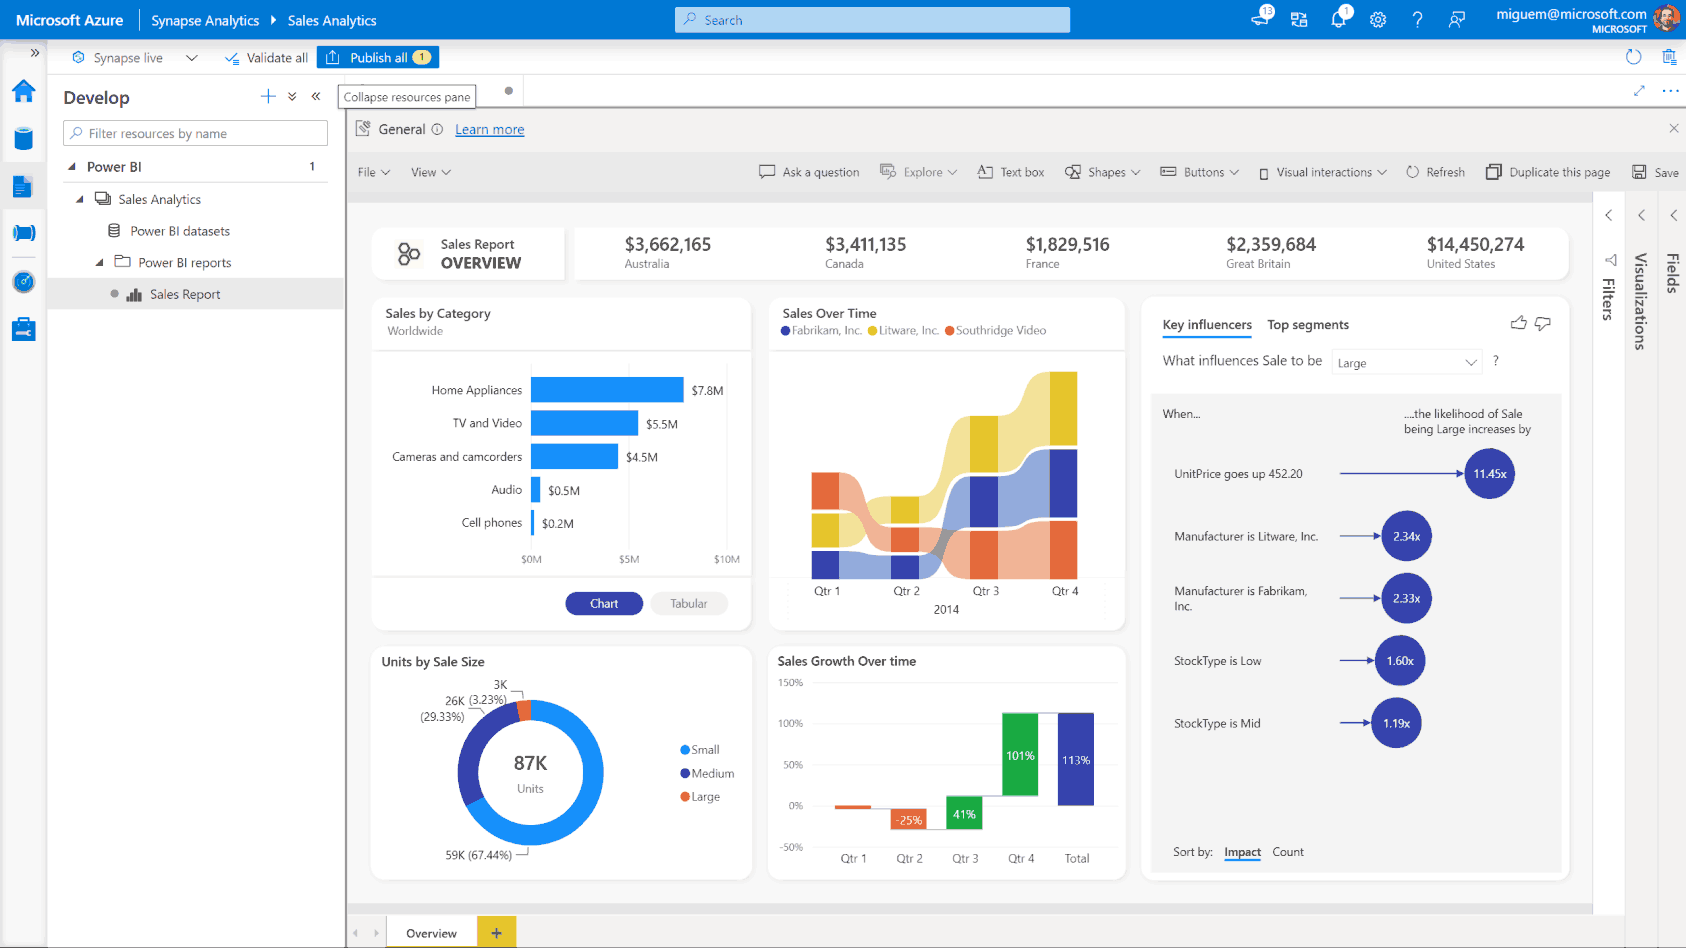
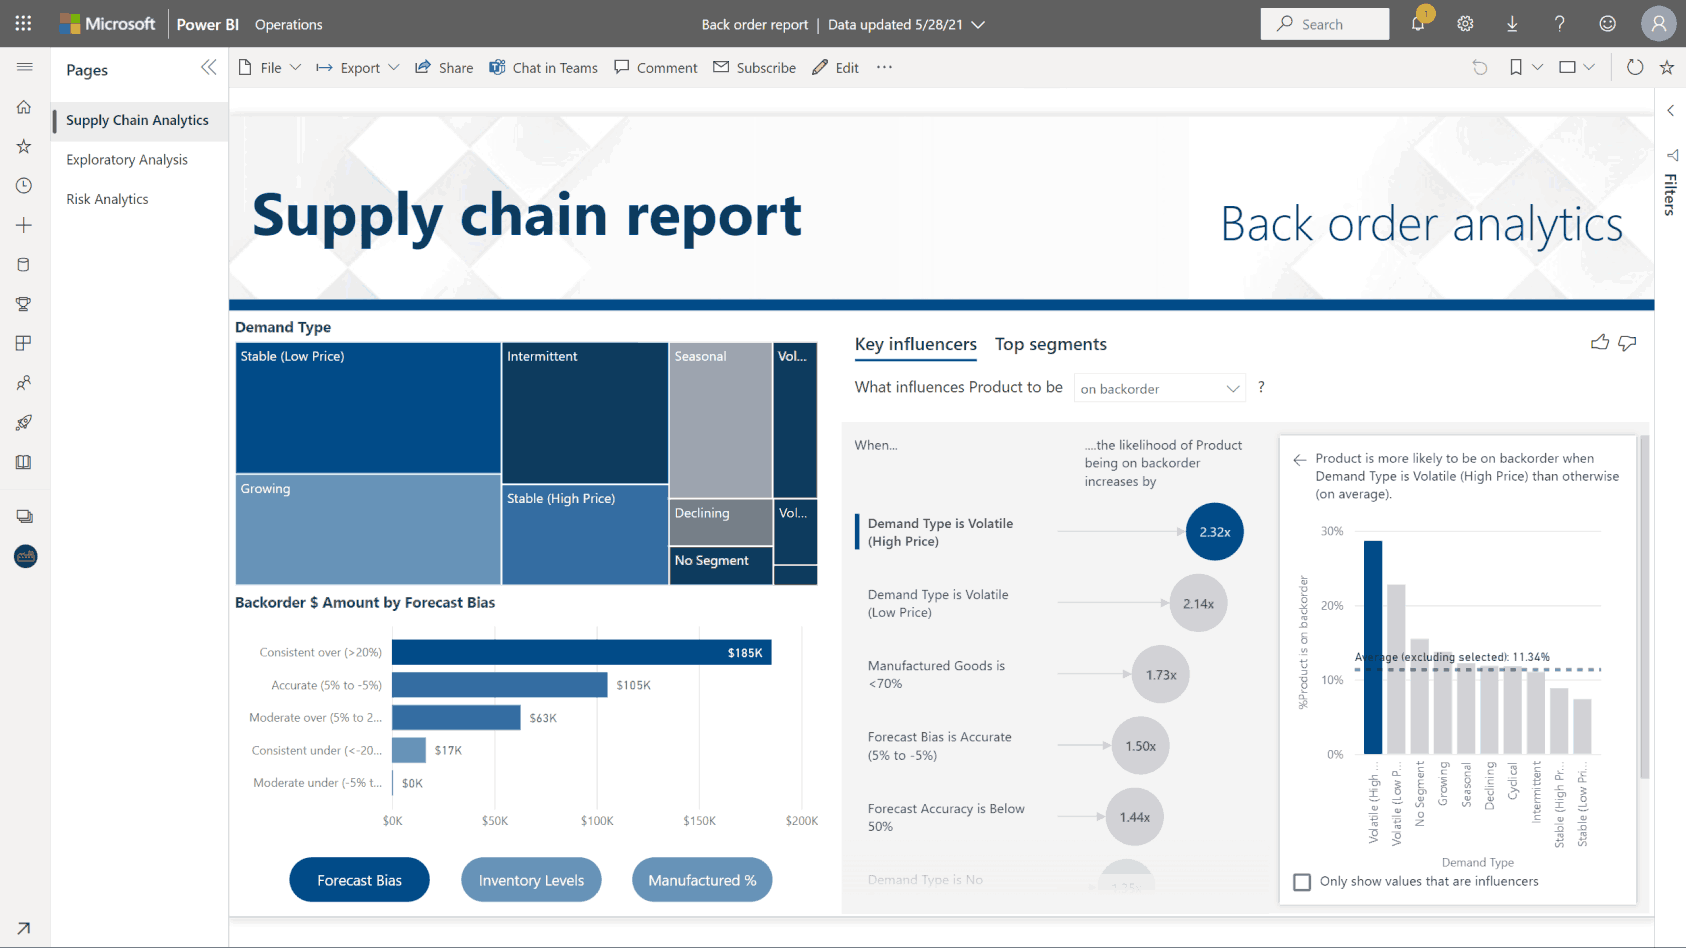
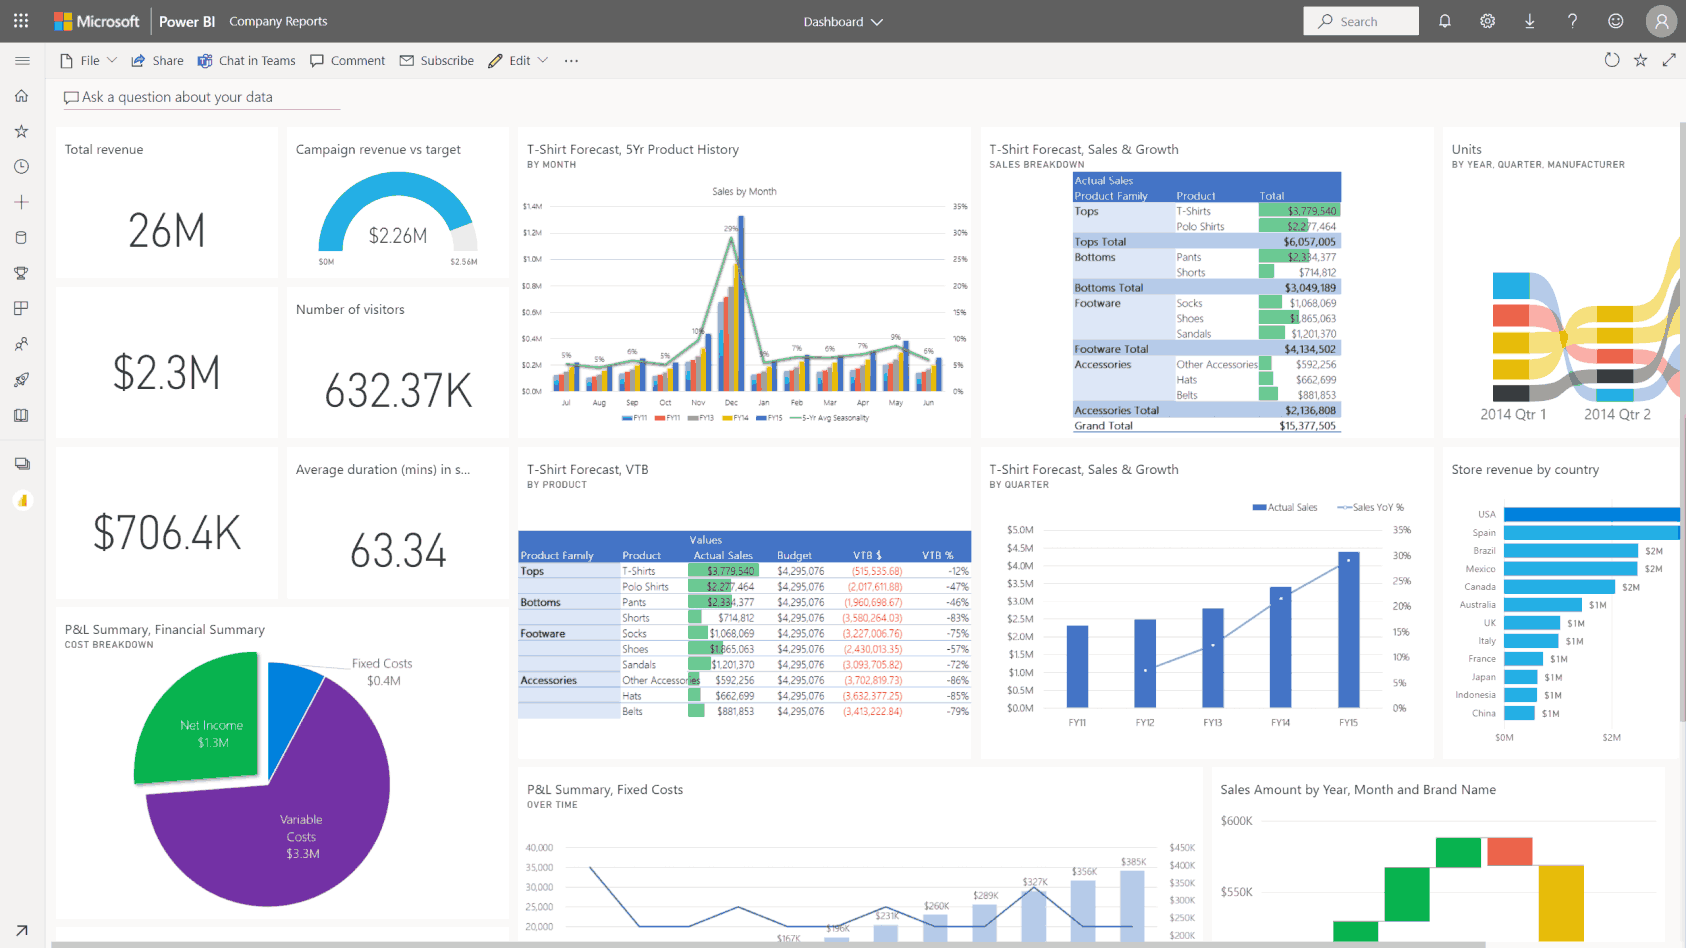
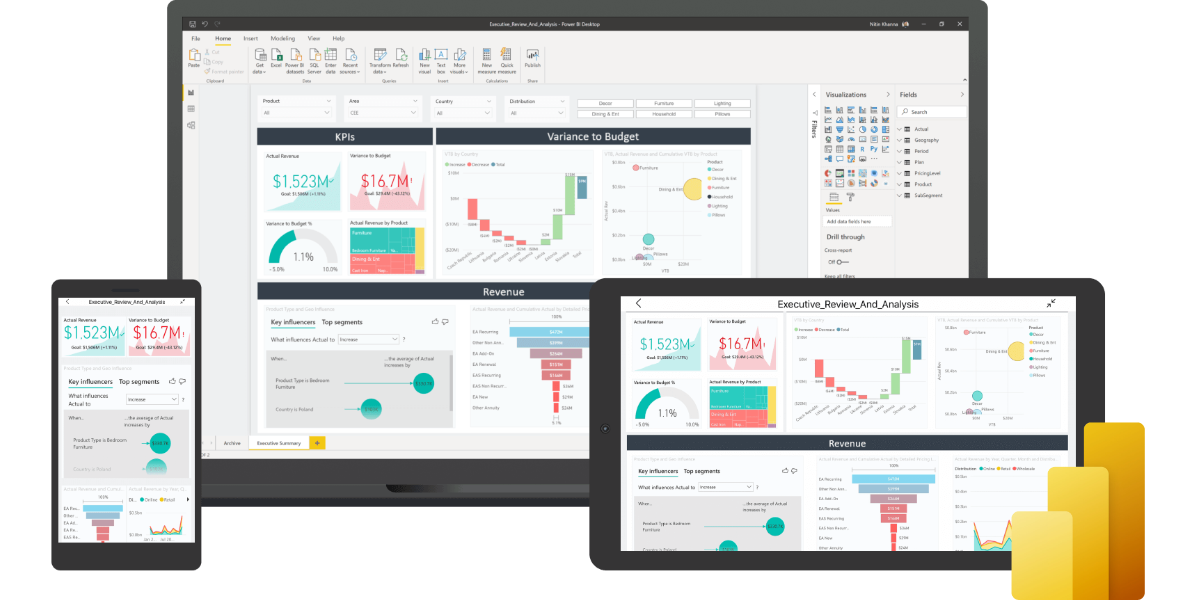
Microsoft Power BI is the ideal platform for business intelligence. It transforms data into meaningful visualizations and reports, allowing your team to make data-driven decisions.
With Power BI’s low-code capabilities, anyone on your team can create customized dashboards, charts, and graphs that bridge the gap between data and decision-making.
Download our Power BI Resource
Copilot in Power BI
Connect. Visualize. Share.
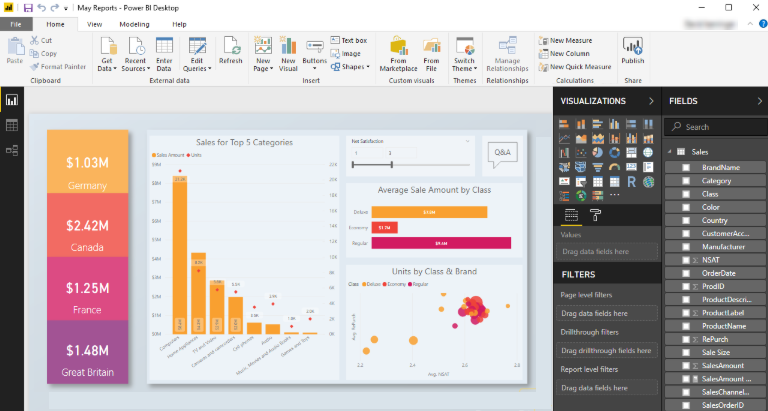
Connect your data and start creating visualizations and reports using Power BI’s drag-and-drop interface. Choose from a range of visualization types to represent your data in a way that makes sense for your business.
Once you’re done, use the built-in sharing and collaboration tools to distribute your reports and dashboards to others within or outside your organization.
The Details
Power BI allows users to connect to a wide range of data sources, including Excel workbooks, SQL Server databases, SharePoint lists, cloud-based services like Azure, online services such as Salesforce, Google Analytics, and many others.
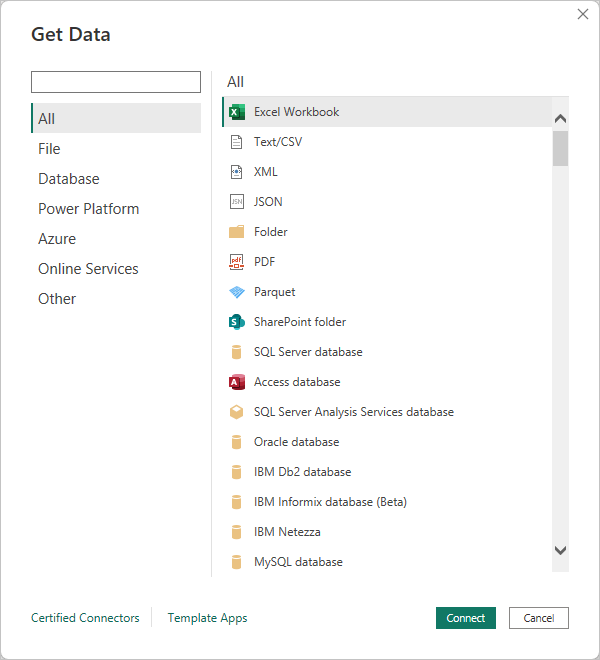
With Power Query (Power BI’s data transformation tool) and Power Pivot (Power BI’s data modeling tool), users can clean, reshape, and combine data from different sources to create a unified and meaningful dataset.
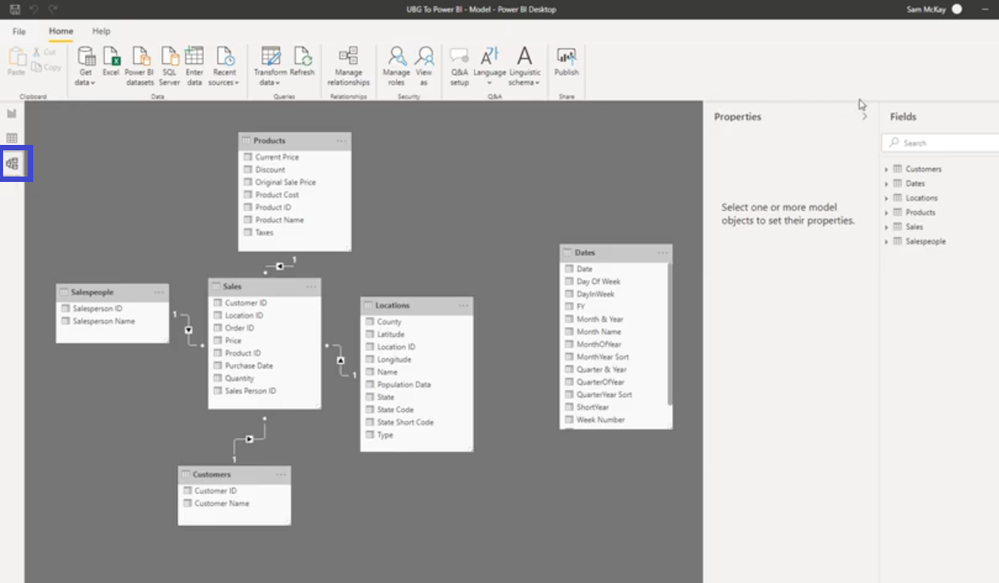
Power BI provides a rich set of visualization options, including bar charts, line charts, pie charts, maps, tables, and more. Users can create interactive and dynamic reports by dragging and dropping fields onto the report canvas.
Power BI uses DAX (Data Analysis Expressions) as its formula language, allowing users to create custom calculations and measures to derive insights and perform complex calculations based on the data model.


